SaaS Valuation Guide: Multiples, Churn and Profit
SaaS valuation explained: how revenue multiples, growth, churn, profit and buyer type set the price, with current 2026 benchmarks to check yours.
The most useful fact about SaaS pricing is how wide the range runs. Across a decade of private SaaS acquisitions, the median deal closed at about 4.5x revenue, but the middle half of transactions ran from 2.4x to 8.1x, and annual medians swung from a 6.3x peak in 2021 to a 2.9x low in 2024, according to Acquire.com's business valuation multiple data. Same model, same recurring revenue, a price that moved by more than half in three years.
That spread is where founders get lost. They read a headline multiple, apply it to their ARR, and arrive at a number no buyer will sign, because the multiple isn't a property of software businesses. It's an output: of how durable the revenue is, how fast it compounds, how much of the base survives each month, how profitable the business runs, and who is on the other side of the table.
What follows is the method for moving from a published benchmark to a range you can defend. Benchmarks set the conversation. They don't set the price.
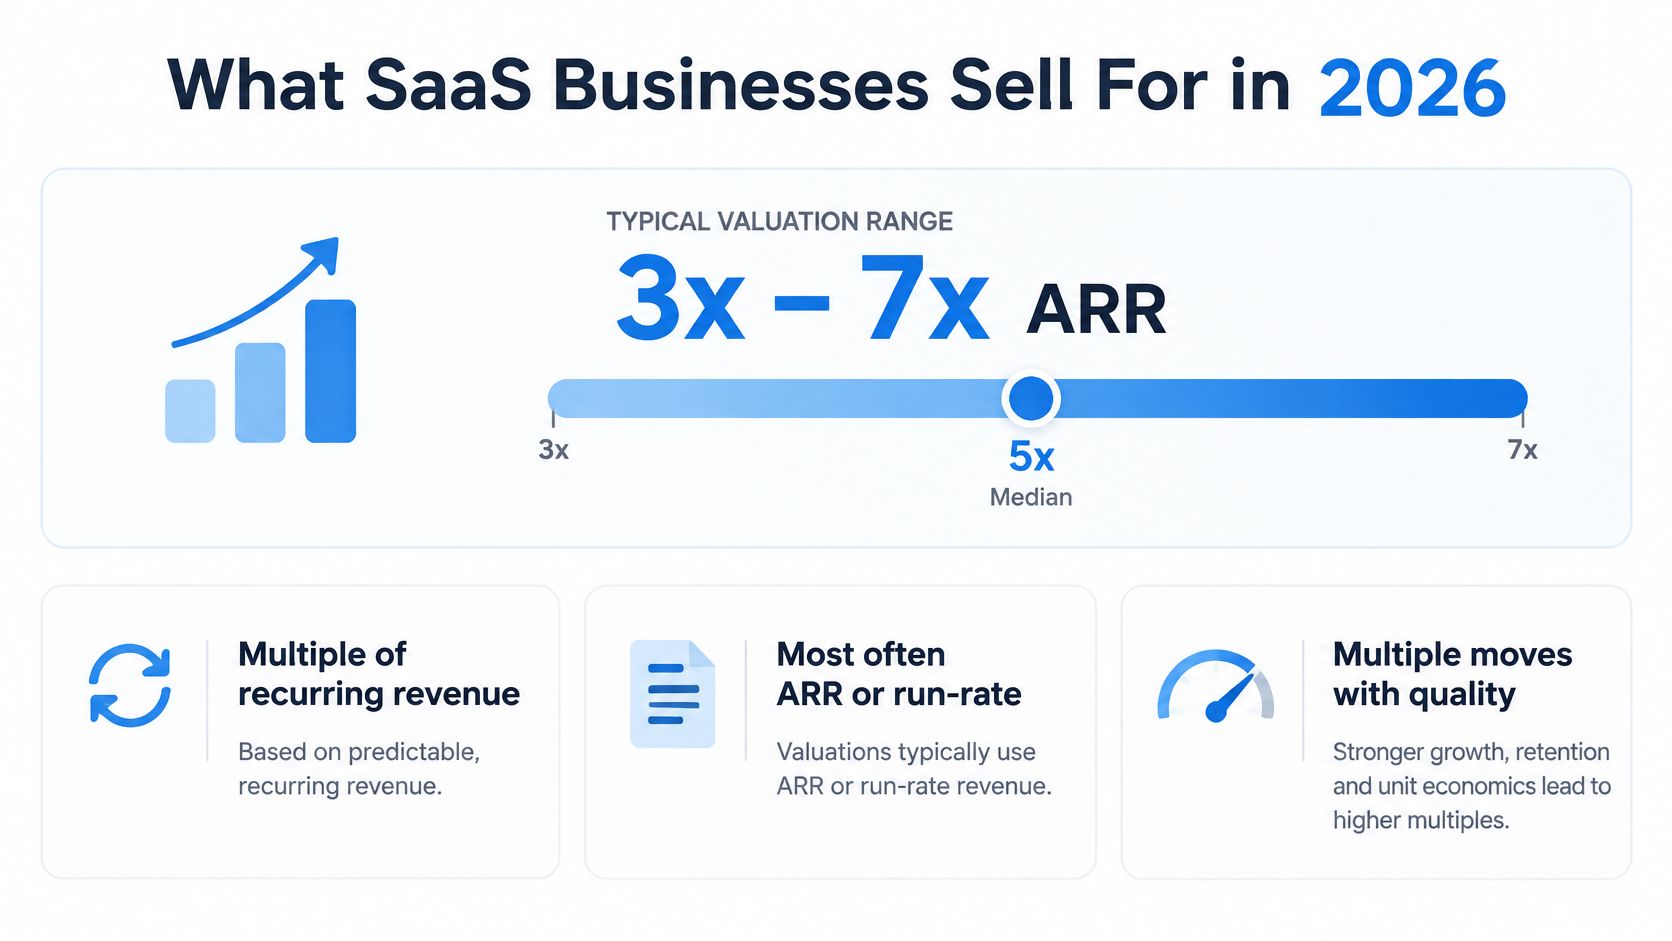
What SaaS Businesses Sell For in 2026
A SaaS valuation is a multiple applied to recurring revenue, most often ARR or current run-rate, and the multiple carries all the disagreement. Public SaaS settled into a band of 6 to 10x ARR by 2025, with one industry analysis putting the median near 7.4x revenue and naming roughly 6.0x to 7.0x as the more defensible long-term reference, since individual companies trade well above or below it on retention, margins, customer concentration and growth (SaaS valuation multiples 2025).
Do not start from 2021. Public SaaS reached median revenue multiples of approximately 15 to 25x ARR in 2021 and about 6.1x revenue by 2023, a reset driven by higher interest rates and slower growth expectations, per the same 2025 multiples analysis. The peak was an exception in capital costs, not a normal baseline for a founder planning an exit.
Here are the published readings side by side, with the market each one describes.
| Benchmark | Market | Multiple | How to read it |
|---|---|---|---|
| Public SaaS peak, 2021 | Public companies | 15-25x ARR | Exceptional, not a normal baseline |
| Public SaaS median, 2023 | Public companies | about 6.1x revenue | Higher rates and slower growth expectations reset prices |
| Public SaaS range, 2025 | Public companies | 6-10x ARR (median near 7.4x) | Stabilized range reported for 2025 |
| Public SaaS, end of 2025 | Public companies | roughly 5.5x revenue | Latest public reading in the analysis |
| Overall software median, Oct 2025 | KBCM/Sapphire survey | 5.1x | Broad software median across sectors |
| Private SaaS acquisitions, 2015-2026 | Private deals | about 4.5x revenue | Middle half of deals 2.4x to 8.1x |
| Private SaaS acquisitions, 2021 | Private deals | 6.3x | Peak year for private deals |
| Private SaaS acquisitions, 2024 | Private deals | 2.9x | Low point in the series |
| Private SaaS acquisitions, Q1 2026 | Private deals | about 3.1x revenue | Most recent private reading |
| Private SaaS profit multiple, 2024-2025 | Private deals | 3.9x | Earnings anchor for smaller firms |
| Modeled run-rate multiple, Jan 2025 | SaaS Capital model | bootstrapped 4.8x; equity-backed 5.3x | Financing history shifts the multiple |
Read the table by matching your business to a row, not by picking the highest number in it. A private company growing 15% with 90% gross retention is not in the 7.4x conversation, and a bootstrapped business with founder-dependent sales isn't in the equity-backed row either.
Practical rule: a benchmark tells you which conversation you're in, not what your business is worth.
How to Estimate a SaaS Valuation Step by Step
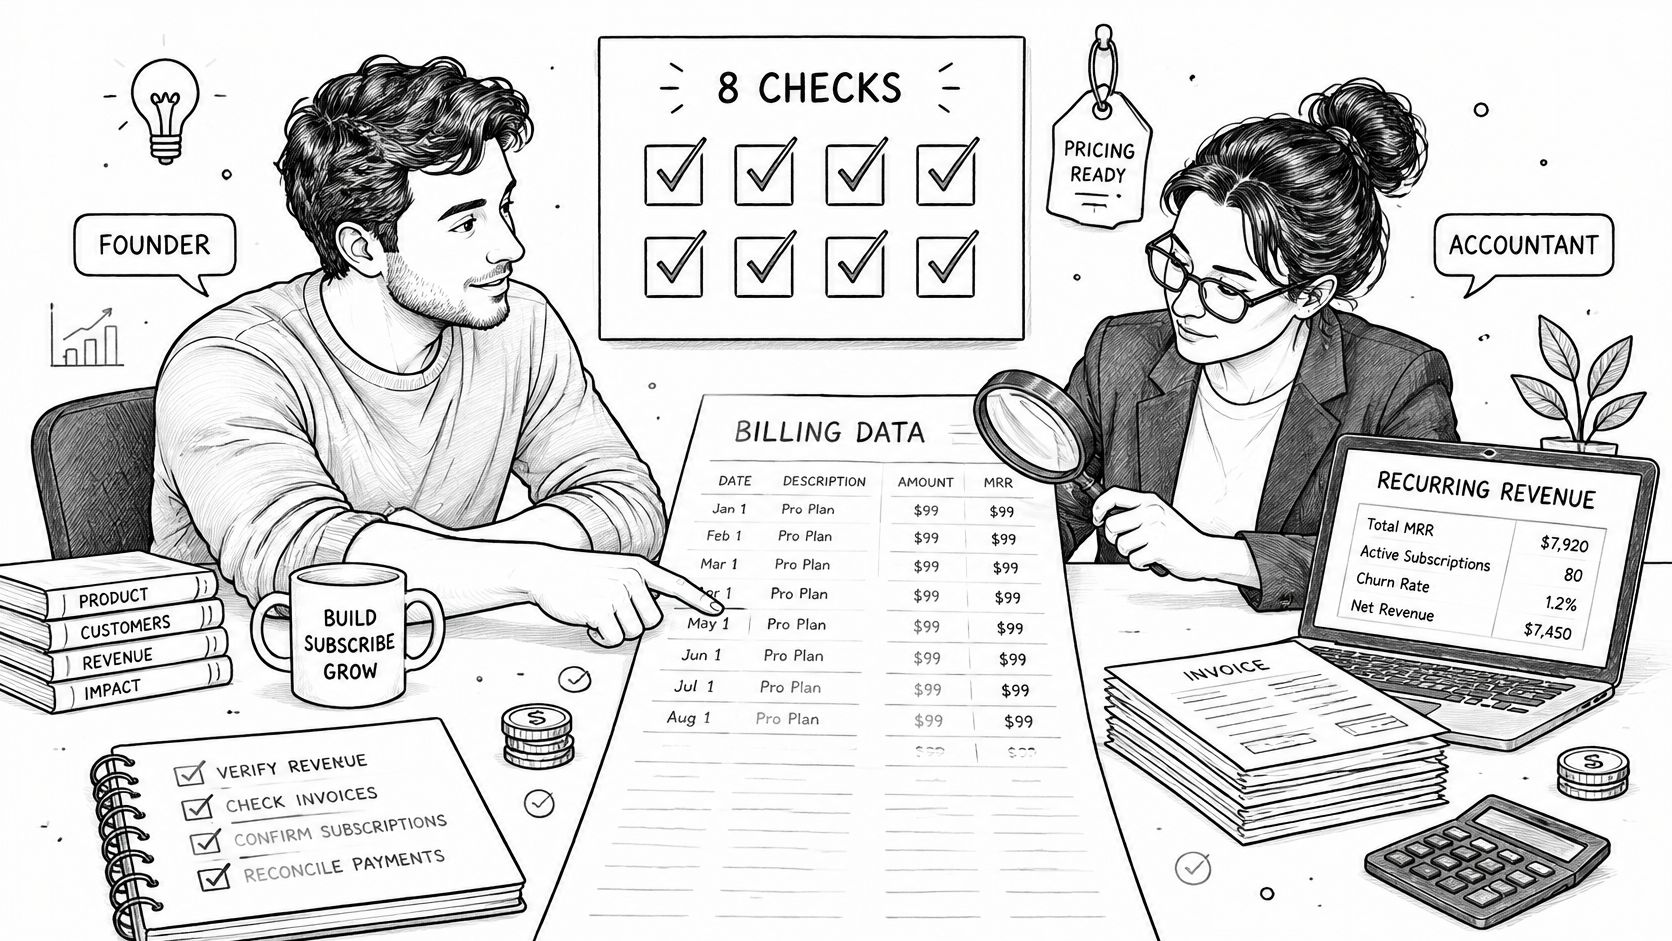
Eight checks turn a headline revenue figure into a range, and each one exists to close a specific gap between what a founder reports and what a buyer is buying.
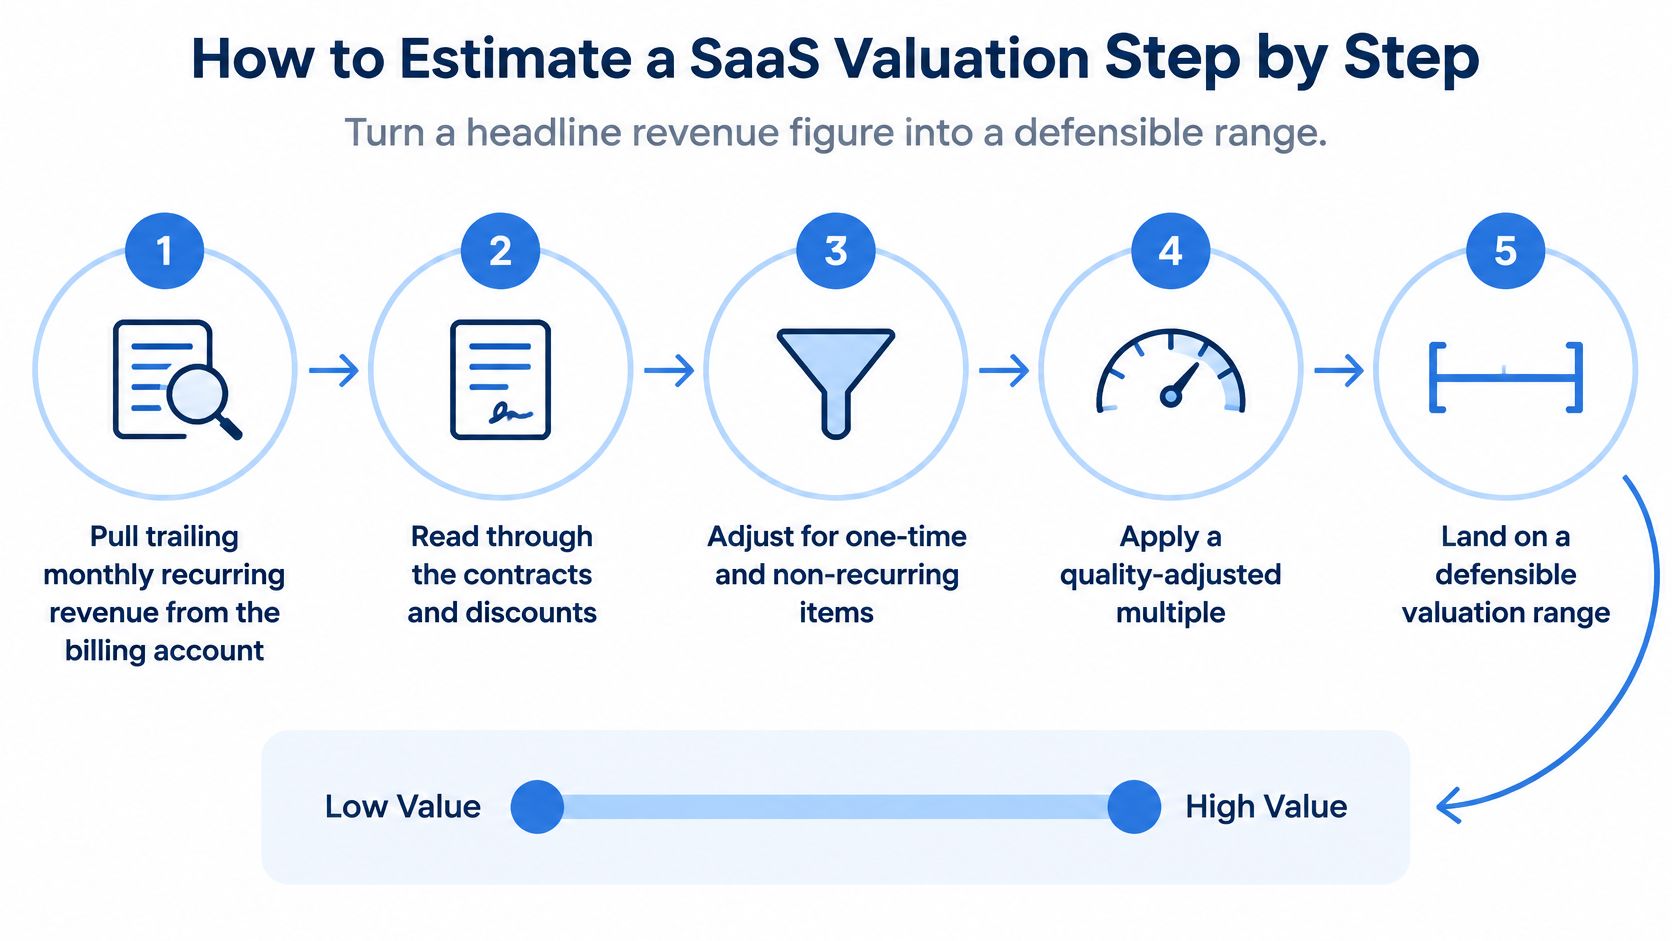
Before the checks, the financing context. SaaS Capital's private SaaS valuation study reported a January 2025 median private-SaaS valuation of 7.0x current run-rate annualized revenue, while its model predicted approximately 4.8x for bootstrapped companies against 5.3x for equity-backed ones. That gap is not a verdict on the economics. It reflects less institutional reporting, fewer standardized controls and heavier founder dependence.
Eight checks that turn a headline multiple into a range
- Pull trailing MRR from the billing account. Connect the provider with a read-only API key and read the subscriptions from source, because a figure typed into a spreadsheet can drift from what the processor charged.
- Annualize into ARR or run-rate and check the trend. One strong month multiplied by twelve flatters a volatile business, so compare the last six months before you annualize anything.
- Strip out non-recurring money. One-off implementation fees, services revenue, paid pilots and usage spikes that won't repeat belong outside ARR, since a buyer isn't purchasing a spike.
- Measure growth on a trailing-twelve-month basis. Twelve months smooths seasonality and stops a single quarter from setting the multiple.
- Document monthly cohort revenue, gross margin, churn, net revenue retention and the share held by the largest customers. Buyers price the durability of the base, and concentration is the fastest way to lose a point of multiple.
- Normalize owner pay and calculate EBITDA or seller's discretionary earnings. A founder paying themselves below market inflates profit, and a buyer will restate it.
- Choose the band from the benchmark table that matches growth, retention and margin. Start at the row your metrics earn, not the row you'd like.
- Reconcile revenue to bank deposits and accounting records. Run-rate ARR overstates value when expansion is volatile or contracts are cancellable, and the reconciliation is where that shows up.
Worked through on a real shape of business: $1.2M verified ARR growing 18% with 85% gross retention sits at the bottom of the private band, near 3.1x, which is roughly $3.7M. A 40% grower with 110% net retention justifies the mid-band near 4.5x, roughly $5.4M. Same revenue line, different business.
Here's the same territory in video form if you prefer to follow the walkthrough visually.
Growth and Churn Set Where You Land in the Range
A multiple is a price paid today for cash that arrives later, so growth raises the price and churn removes the base the multiple was applied to. Run the arithmetic on a $1M ARR business. At 2% monthly churn, roughly 21% of the base is gone within a year. At 0.5% monthly churn, about 6% goes. The buyer sees two companies with identical revenue today and completely different revenue in year three, and prices accordingly.
Gross retention is the floor, net retention is the upside
Gross revenue retention shows how much of last year's base survives before any expansion. It's the floor, and it's the number that tells a buyer whether the product holds customers once they've bought.
Net revenue retention shows what happens after churn and upsell are combined. Above 100% means the existing book grows on its own; below it, the founder is running to stand still on a treadmill that speeds up each year.
A business that grows fast while losing customers fast is renting growth, not owning it.
Growth quality matters as much as the rate. Revenue from new customers who leave within four months is worth less than slower growth that stays, and buyers read that difference in the cohort curves. Flattening curves suggest a stable product and a defined customer. Newer cohorts that decay faster than older ones are the warning sign: something changed in acquisition, onboarding or pricing, and the buyer inherits whatever it was.
Two questions settle most of this before a valuation conversation starts. What was monthly churn over the last twelve months, measured from the billing provider rather than a memory of the dashboard? And does the newest cohort retain like the one from eighteen months ago? If the second answer is no, fix the cause before you fix the multiple, because no adjustment to the band survives a cohort chart that slopes the wrong way.
Rule of 40 and When Profit Matters More
A company growing 45% while losing 20% at the EBITDA line scores 25 on the Rule of 40. A company growing 30% at a 10% margin scores 40. The slower business usually wins the valuation argument, which is the first thing founders get wrong about growth.
The Rule of 40 adds revenue growth percentage to EBITDA margin and treats 40 as the benchmark, and the 2025 KBCM/Sapphire SaaS survey reported an overall software valuation median of 5.1x as of October 2025 while describing the metric in exactly those terms. The logic is straightforward: growth increases expected future cash flows, profitability reduces the capital needed to reach them, and a company weak on both faces a double discount.
| Company | Revenue growth | EBITDA margin | Rule of 40 score | How it reads |
|---|---|---|---|---|
| A | 30% | 10% | 40 | Meets the benchmark |
| B | 45% | -20% | 25 | Faster growth but a weaker score |
| C | 20% | 25% | 45 | Profitable growth clears the benchmark |
| D | 15% | -5% | 10 | Weak on both measures, double discount |
When the earnings anchor beats the revenue multiple
For smaller and bootstrapped businesses, an earnings multiple is a more realistic anchor than a headline revenue multiple, because the buyer is purchasing cash flow they can take out rather than a growth story they must fund.
Take a bootstrapped firm with $1.2M revenue at a 20% EBITDA margin, which produces $240K of profit. Apply the 3.9x private profit multiple and the anchor lands near $936K. That's the number a cash-flow buyer opens with, before comparing it against any revenue-multiple view. A 15% grower with a 30% margin can be worth more to that buyer than a faster grower that burns cash, and the two valuations won't reconcile until you decide which buyer you're talking to.
What to compute first: your own Rule of 40 score, and its direction over the last three years.
Calculate it on consistent trailing-twelve-month figures, state plainly whether the margin is EBITDA or free cash flow, and show the trend rather than one period. Retention sits underneath all of it: public-company benchmark data summarized by Adlega showed median net revenue retention of 110% among companies disclosing it, with companies scoring at least 40 receiving materially higher revenue multiples than weaker performers, per the same KBCM/Sapphire survey.
Which Revenue Counts Toward a Premium
A dollar of ARR isn't a dollar of value. Two businesses can report the same headline figure and land three multiple points apart, because buyers pay for the part of the revenue that survives the transition and discount the rest.
The dispersion is not theoretical. The median private SaaS acquisition multiple fell from 6.3x revenue in 2021 to 3.1x in the first quarter of 2026, according to SaaS valuation research on revenue quality, while larger and stronger companies continued to clear well above the median. The question that decides where you sit is which parts of your ARR are transferable.
| Revenue type | Typical treatment | Why |
|---|---|---|
| Contracted subscription revenue | Counts toward ARR at full weight | Recurring and transferable |
| Usage spikes | Normalized to a sustainable baseline | May not repeat after a sale |
| Paid pilots | Usually excluded from ARR | Not yet recurring |
| One-off implementation fees | Excluded from ARR | Non-recurring by nature |
| Founder-led sales | Discounted if the founder is leaving | Depends on one person |
| Large share held by top customers | Discounted for concentration | One loss moves the value |
| Cancellable or month-to-month contracts | Weighted by historical retention | Revenue can leave quickly |
Where reported ARR overstates what a buyer gets
Concentration does more damage than most founders expect. If the top five accounts hold most of the MRR, a single cancellation rewrites the valuation, and buyers price that risk before they price growth. Net retention, gross retention, cohort behavior and concentration belong in one conversation, not four separate slides.
The contrarian point is worth sitting with. A smaller, diversified SaaS with stable retention can earn a higher multiple than a faster-growing business whose growth comes from volatile usage or a handful of accounts. This bites hardest on bootstrapped companies, where founder-led relationships and informal sales processes make reported ARR look stronger than the buyer's post-acquisition economics will be.
Tag every revenue line by type, separate recurring from total revenue, and calculate the durable share. Then remember what provider data does and doesn't prove: it shows what the billing system recorded, not whether the revenue is sound. That's why every figure still gets checked against bank deposits and the accounting records before a multiple is applied.
How Buyer Type Changes the Price
One business can sell at three different prices in the same month, because each buyer is paying for something different. Bootstrapping is not automatically a discount. It earns a premium when cash flow is dependable, the business needs no further capital, working capital is light, technical debt is low, and the founder's role can be handed over. It earns a discount when growth is slow and the founder is the product.
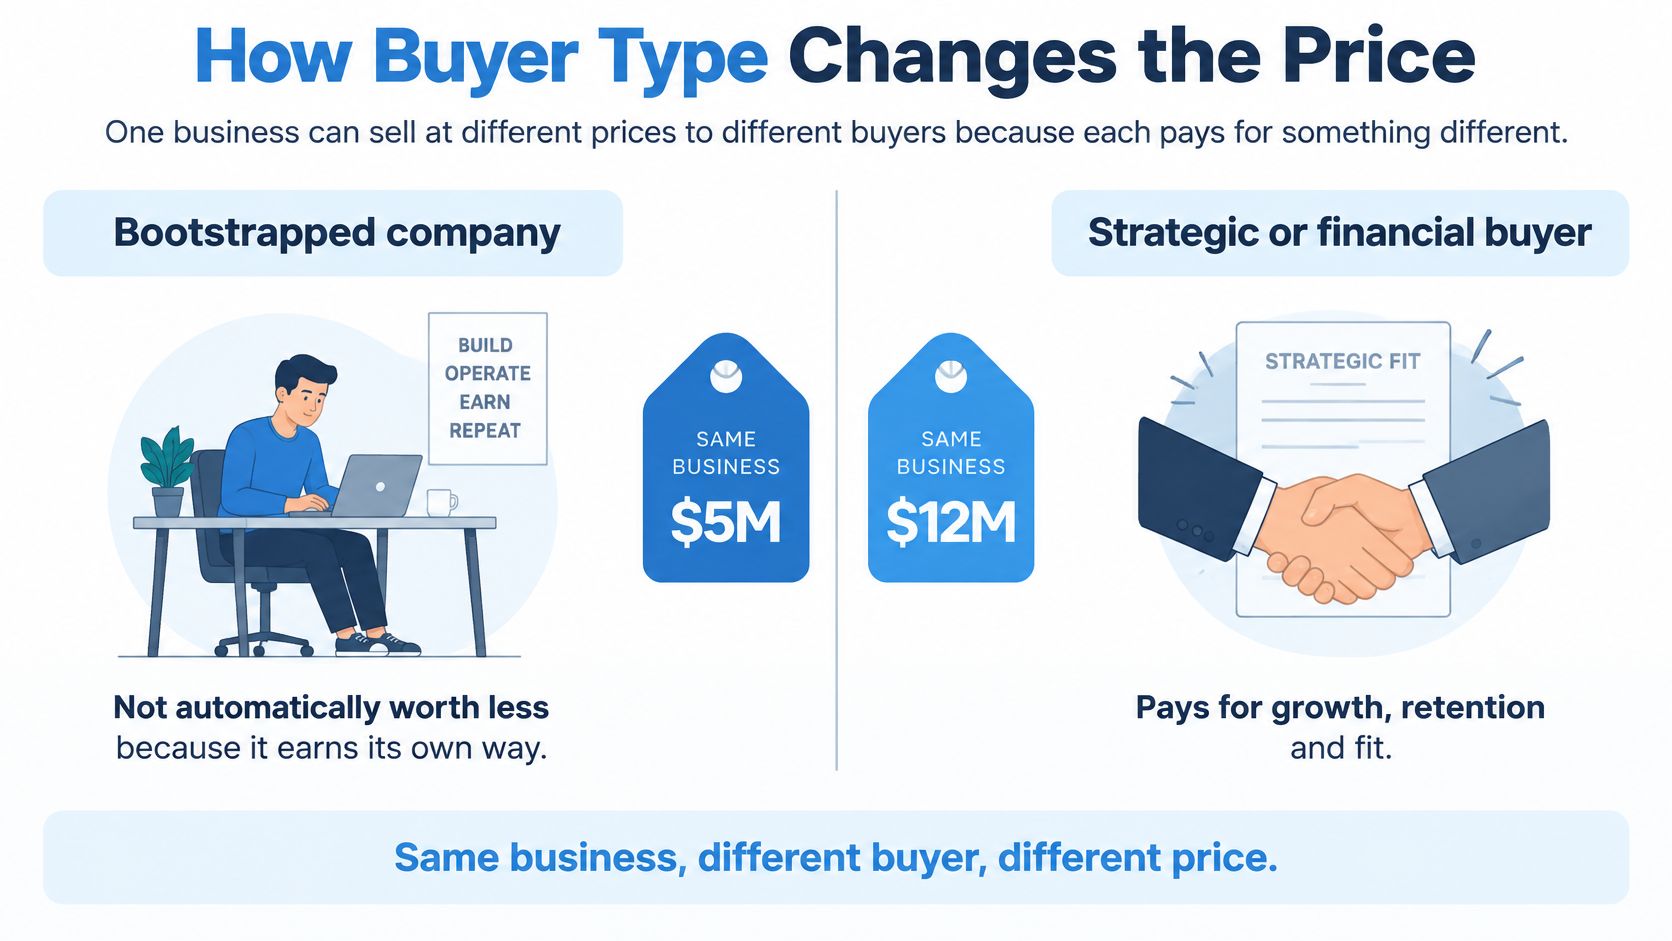
Current transaction data makes the point sharper than any model. Private SaaS acquisitions were running at roughly 3.8x revenue in 2025, per 2026 SaaS valuation multiple data, and the same source argues that market timing, deal size, profitability, growth quality and buyer financing conditions can outweigh funding history entirely. "The SaaS multiple" isn't a stable answer to anything.
| Buyer | Pays for | Price logic | Main risk |
|---|---|---|---|
| Cash-flow buyer | Owner earnings and operational simplicity | Payback period on the purchase price | Paying for revenue that needs heavy support |
| Strategic acquirer | Distribution, product fit and synergies | Value added to their existing business | Paying for synergies that never arrive |
| Financial investor | Scalable growth and cash flow | Return target over the holding period | Growth slowing after the deal closes |
| Individual operator | Income they can run themselves | Owner earnings multiple | Founder dependence they must replace |
Investor valuation is not an acquisition price
An investor valuation weighs future growth against a required return. An acquisition price reflects what the buyer can take out of the business or add to their own. A strategic buyer may pay for distribution or product synergies that never appear on your P&L, while an individual buyer prioritizes immediate cash yield and operational simplicity.
Run all three lenses on the same business: cash flow, strategic fit, financial return. Then identify which assumption drives most of the spread between them. Usually it's one variable, either growth durability, margin, or founder dependence, and that variable is where negotiation will happen.
The question that sets the price: which buyer am I, and what will this business earn in my hands over the first two years?
Edge Cases Where Standard Multiples Break Down
The multiple framework fails at the edges, and each edge needs a different treatment rather than a wider guess.
- Pre-revenue or first-revenue businesses. A $0 verified figure is not a valuation. Price on early conversion, retention signals and the cost of getting to the first hundred customers, and present a deliberately wide band.
- Stable but shrinking businesses. Flat ARR with rising churn doesn't deserve a growth multiple at all. Value on cash yield, and discount any projection that assumes a return to growth.
- Deals with earnouts. The headline number includes contingent payments that may never arrive. Value the cash at close separately from the earnout, and treat the earnout on its own probability.
- Businesses mid-pivot. A product change resets the cohorts, and retention data from the old product may not transfer. Underwrite the new product on its own evidence, not on the inherited chart.
- Asking prices on a listing. An asking price is the seller's opening number. Compare it with recent closed deals of similar size and shape before treating it as evidence of anything.
When a case fits none of these, fall back to the earnings anchor and widen the band rather than forcing a single figure. A range that reflects genuine uncertainty is more credible to a buyer than a precise number built on assumptions nobody believes.
Verify Your Revenue Before You Price or Sell
Verify first, price second. Run the eight checks so the figures you present come from the billing provider, twelve months of cohorts and normalized earnings, because every later decision inherits whatever errors survive that step.
Then convert the verified figures into three values. Set the low from the cash-flow lens and the earnings anchor. Set the mid from the benchmark band that matches your growth and retention. Set the high only when concentration is low and retention is confirmed cohort by cohort. If the high value depends on a single customer staying, it isn't a high value.
BootstrapArena is a verified revenue directory for bootstrapped SaaS, e-commerce and mobile apps, ranked by verified revenue, and its marketplace listings show the asking price plus, for verified startups, the MRR read from the billing provider and the resulting revenue multiple. To list a business for sale, a founder submits the startup as usual, opens 'Want to sell this startup?' at the end of the form and enters an asking price.
That asking price is an opening number. Buyers still run their own diligence on retention, concentration and cash, which is exactly why the verification work comes before the listing.
If you're preparing to price or sell a bootstrapped SaaS business, BootstrapArena gives you a place to put verified numbers in front of buyers rather than a spreadsheet they have to trust. List your product for free, connect your billing provider, and let the MRR, ARR and revenue multiple sit on the same page as your asking price. Start with the verification, then open the sale conversation when the numbers hold up.