10 SaaS Metrics Every Founder Should Track in 2026
Learn the 10 essential SaaS metrics founders should track, with formulas, worked examples, and tips for interpreting MRR, churn, NRR, CAC, LTV and more.
Revenue has climbed for six straight months. You've screenshotted the chart, answered the congratulation messages, and started to believe the number. Then you check the bank balance and it's lower than it was in January.
Nothing broke. You measured the thing that goes up and ignored the things that decide whether the increase is worth having. Annual plans paid up front, a support tool nobody cancelled, a paid channel that costs more to run than the customers it brings in. Each one is invisible in a revenue chart and obvious in a cash one.
Bootstrapped businesses feel this faster than funded ones because there's no buffer between a bad read and a payroll decision. A venture-backed company can be wrong about CAC payback for two quarters and raise again. You get one quarter.
The ten SaaS metrics below aren't a checklist to fill in. They work as a system. MRR and ARR describe what you sell, churn and net revenue retention describe whether it stays sold, ARPU, CAC and LTV describe whether each customer is worth having, and the ratio, payback period and burn multiple describe whether you can afford to keep doing it. Read one alone and it flatters you. Read them together and they argue, which is the entire point.
1. Monthly Recurring Revenue (MRR)
Your MRR is the recurring revenue your active subscriptions produce in a month, with quarterly and annual plans converted to a monthly equivalent. It should change your behaviour weekly, because a flat month tells you something moved in acquisition, retention or pricing even when you can't yet say which.
This is also the number people see first on a public profile, so the arithmetic has to hold up.

Convert Every Plan Before You Add Anything Up
Say you have 200 customers on $49 a month and 20 on a $490 annual plan. The annual customers are worth about $40.83 a month each, so your MRR is $9,800 plus roughly $817, or about $9,967. The annual share is the part founders get wrong, by counting $9,800 in month one and zero for the next eleven.
Then split the total into its four movements, because the headline hides which one is winning.
- New MRR from first-time customers, which tells you whether acquisition is working at all.
- Expansion and contraction MRR from upgrades and downgrades, which tells you whether pricing and packaging fit.
- Churned MRR, which tells you how much of this month's work replaced last month's losses.
Trust check: if your MRR lives in a spreadsheet someone updates on the first of the month, it's self-reported and it will drift. Read it from your billing provider instead.
For a bootstrapped business the composition matters more than the total. An MRR built on annual prepayments is cash today and a renewal cliff in eleven months. Plan hires against the monthly equivalent, not the bank balance.
2. Annual Recurring Revenue (ARR)
ARR is MRR multiplied by twelve, and it exists because buyers, investors and founders all think in years. Gartner forecast worldwide SaaS spending at $299.1 billion for 2025, as recorded in this collection of SaaS market statistics, and the annual frame is the one used whenever a business in that market gets compared, priced or sold.
Take a business at $15,000 MRR. Its ARR is $180,000, and that's the figure a buyer will multiply by a revenue multiple when the listing goes live.
Three rules keep ARR honest.
- Count active paying subscriptions only. A contract signed today that starts in six weeks is not ARR yet, whatever the pipeline review says.
- Show twelve months of history. A single ARR snapshot invites a buyer to assume the last month was typical.
- Publish the method. Whether you include a paused plan or a customer in their first month changes the figure by more than most founders expect.
For a bootstrapped business, ARR is the metric most likely to be quoted and least likely to be cash. A $180,000 ARR company that invoices annually collected that money months ago and won't see more until renewal. One that bills monthly sees $15,000 arrive every month. Same ARR, entirely different ability to survive a bad quarter, and entirely different bargaining power when a supplier or a landlord asks for terms.
3. Customer Churn Rate
Churn is the share of customers who cancel or fail to renew in a period, and it decides whether acquisition spending builds anything. A product losing 20 of 400 customers in a month has 5% monthly churn. Compounded over a year that leaves roughly 54% of the base, so a fifth of the damage lands in the first month and the rest arrives gradually.

Two versions of the number matter and they diverge. Customer-logo churn counts accounts. Revenue churn counts dollars, so losing three small accounts hurts less than losing one enterprise account, and the two rates can move in opposite directions in the same month. Benchmarkit's 2022 reporting put adoption at 73% for gross dollar retention and 74% for customer-logo churn, per its retention benchmark report, which tells you both are standard practice rather than advanced analysis.
Then split voluntary from involuntary. A declined card is not a customer decision, and dunning emails plus a card-updater tool recover a real share of it. Founders who assume churn is a product problem often find a billing problem in the mix. Your churn rate also sets the value of the business when you sell it, as this guide to how churn feeds a SaaS valuation explains.
4. Net Revenue Retention (NRR)
NRR is the revenue a fixed cohort of customers produces a year later, after expansion, contraction and churn, with new customers excluded. Beginning ARR plus expansion, minus churned and downsell, divided by beginning ARR. A cohort that starts at $50,000 and ends at $58,000 has 116% NRR, meaning it grew without a single new sale.
SaaS Capital's 2025 retention benchmark reports a median NRR of 101% across SaaS companies, 103% for multi-year contracts, and median gross retention of 91%, per its B2B SaaS retention benchmarks. Read those together. Gross retention is what you keep before expansion, and the ten-point gap between 91 and 101 is the entire engine.
Here's how that decomposition looks in practice.
The decision NRR drives is whether you can grow without new logos. Above 100%, a flat sales month is a delay rather than a crisis. Below 100%, every new customer is paying for a leak.
For bootstrapped founders the honest caveat is cohort size. A 116% NRR produced by two large upgrades is a data point, not a trend, and it reverses when those accounts right-size. Segment by customer size before you believe it.
5. Average Revenue Per User (ARPU)
ARPU is MRR divided by paying customers. A SaaS with 800 paying users and $38,400 MRR has an ARPU of $48 a month, and that number means nothing until you know which customers it averages.
Segment Before You Act on It
A blended ARPU of $48 can hide a self-serve tier at $19 and an enterprise tier at $600. The average moves when the mix shifts, not when pricing improves, so rising ARPU alongside flat tier pricing usually means you sold more enterprise rather than that you monetized better. Pull ARPU by plan, by acquisition channel and by tenure.
A price rise that lifts ARPU and lifts churn by the same amount has bought you nothing.
The decision ARPU should drive is where the next product investment goes. If the top tier is 15% of customers and 45% of revenue, the roadmap belongs there, and the onboarding work belongs there too.
On trust, state whether trials, free users, and one-time payments are excluded. Most reported ARPU figures include one of the three, which is why two dashboards inside the same company disagree. For a bootstrapped product, a defensible ARPU read from billing beats a flattering one assembled by hand.
6. Customer Acquisition Cost (CAC)
CAC is everything you spent to win customers in a period, divided by the customers you won. Everything is the operative word. A business that spends $6,000 on ads plus $4,000 on tools, agency fees and a slice of founder time to win 50 customers has a CAC of $200, and that's the only version worth making decisions with.

Paid-only CAC is a different metric. It tells you how one channel performs, which is useful, and it makes the whole business look more efficient than it is, which is dangerous. Report both and label them.
Benchmarks are context, not a target. High Alpha's 2024 SaaS Benchmarks Report surveyed more than 800 SaaS companies, per the 2024 SaaS benchmarks survey, and the median in that dataset reflects a sales motion, price point and market that probably isn't yours.
- Match spend to the period that produced it. A campaign that pays back in month three shouldn't be judged on week-one signups.
- Cut the number by channel. Blended CAC hides the channel losing money.
- Charge founder time at a real rate. Otherwise organic content looks free when it isn't.
For a bootstrapped business, launch traffic, directory listings and content keep blended CAC low. That's a genuine advantage. Just don't let it hide a paid channel costing $400 a customer.
7. Customer Lifetime Value (LTV)
LTV is the gross profit you expect from a customer across the whole relationship, and it sets the ceiling on what you can pay to acquire one. The working formula is ARPU multiplied by gross margin, divided by monthly churn. An ARPU of $50 at 80% gross margin and 4% monthly churn gives $1,000.
Gross Margin, Not Revenue
The most common error is computing LTV from revenue. That inflates the result by exactly your cost of serving, which for a hosting-heavy or support-heavy product is the difference between a viable channel and an unviable one. Use gross margin after infrastructure, support and payment fees.
Then cap the horizon. A formula that assumes a customer stays 25 months at 4% churn is a straight-line extrapolation, and few products behave that way for two years running. Cap at three to five years and treat the output as a range rather than a fact.
- Compute by cohort and channel. Customers from a partner integration and customers from a cold ad rarely share a lifetime.
- Write the assumptions down. ARPU source, margin source, churn window, cap.
- Recalculate when pricing changes. A plan revamp invalidates every LTV built on the old one.
The decision LTV drives is your maximum CAC. For a bootstrapped business, an LTV built on one good cohort with two enterprise logos in it is not a licence to spend.
8. LTV to CAC Ratio
Divide LTV by CAC and you get the fastest read on whether growth pays for itself. LTV of $1,200 against a CAC of $300 is 4:1, or four dollars of gross profit for every dollar of acquisition spend.
Benchmarkit's 2025 dataset reports a median CLTV-to-CAC ratio of 4.1x with the top quartile reaching 7.8x, and vertical SaaS at a 5.6x median against 4.1x for horizontal SaaS, per its 2025 SaaS benchmark report. The 3:1 figure everyone quotes is a floor for viability, not a target to hit and then stop measuring.
Read it monthly, not annually. Both inputs move. A pricing change moves LTV, a channel shift moves CAC, and a ratio that was 4:1 in January can be 2.4:1 by June without anyone making a decision.
The decision this ratio drives is whether to increase paid spend. Below 3:1, more spend usually buys more of the same problem. Above it, with the ratio stable across several cohorts, your constraint is cash rather than economics.
For a bootstrapped business the trap is a ratio calculated once, on a small cohort, with an LTV that assumed 3% churn and then delivered 6%. Recompute monthly and keep the inputs visible on the same page. At 4.1x you're sitting on the median, which means half the market is doing better with the same metric and half is doing worse.
9. CAC Payback Period
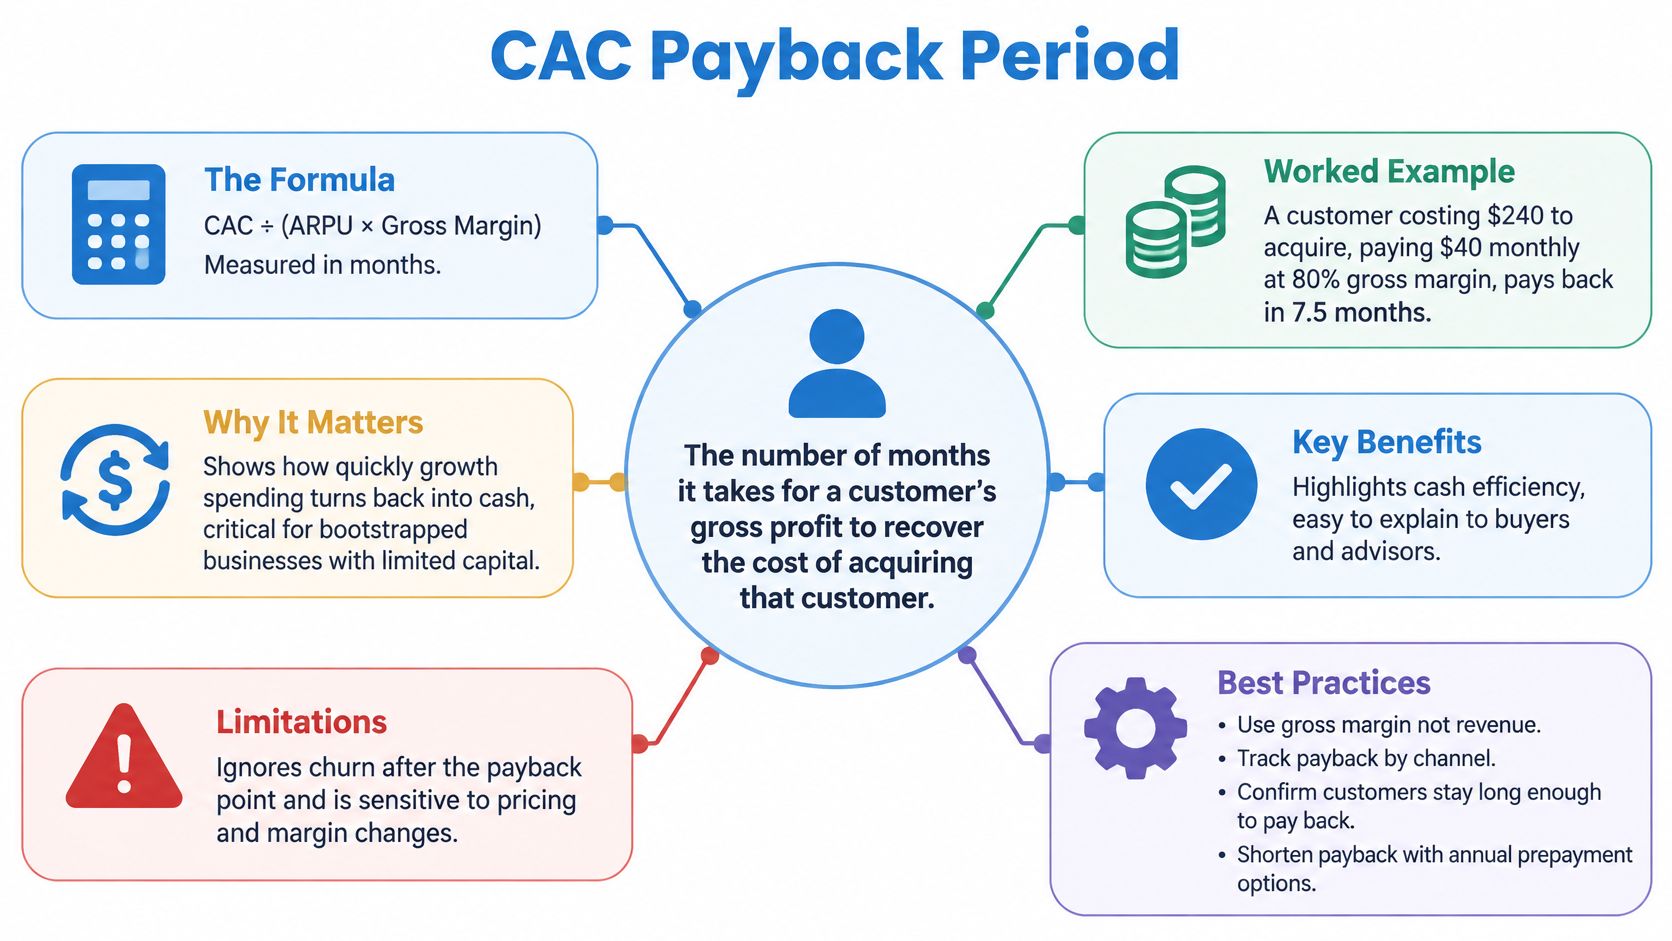
Payback answers a different question from the ratio. Not whether a customer is profitable, but how long your cash is out of the business before it comes back. The formula is fully loaded CAC divided by monthly gross profit per customer, where gross profit is new customer MRR multiplied by gross margin.
A customer who costs $240 to acquire, pays $40 a month and carries an 80% gross margin returns $32 of gross profit monthly, so payback is 7.5 months. That single figure decides whether you can afford to grow at your current bank balance.
The market range is wide. A 2025 SaaS benchmark summary reports that the most efficient teams recover CAC in 13 months or less across ARR bands, while another industry benchmark puts median CAC payback at 18 months, per Benchmarkit's 2025 benchmark data.
- Adjust for gross margin. Bookings or unadjusted ARR overstates payback quality and makes a bad channel look fine.
- Track by channel and contract size. Blended payback hides both your best source and your worst.
- Offer annual prepayment. It turns a multi-month payback into an immediate one for the customers who take it.
For bootstrapped founders, this is the metric I'd watch above all others. You can be wrong about LTV for a year and still trade. You can't be wrong about payback and still make payroll.
10. Burn Multiple
Burn multiple is net cash burned divided by net new ARR in the same period. A company burning $300,000 in a quarter while adding $150,000 of net new ARR has a burn multiple of 2, so two dollars spent for each dollar of recurring revenue added.
Why It Belongs Beside the Others
MRR tells you the size of the business. Burn multiple tells you the price of getting bigger. A company adding ARR at a multiple of 4 is buying growth at a rate that only works if retention is exceptional, and the metric puts that trade in plain view before the balance does.
The assumption underneath it is breaking for AI products. Benchmark coverage cited in this 2026 SaaS benchmark review places AI-native gross margins at roughly 55% to 70%, against about 80% to 85% for enterprise SaaS. When every customer interaction carries an inference cost, revenue can climb while contribution profit falls, and a burn multiple calculated on revenue alone stops meaning anything.
Cash spent on inference is not marketing spend, and a burn multiple that lumps them together hides the problem.
So calculate it on net burn, quarterly, and adjust for annual prepayments so one large invoice doesn't flatter a period. Then look underneath at contribution margin per retained customer after model and infrastructure costs. I treat anything above 2 as a signal to fix the engine before adding fuel. For a bootstrapped business there's no funding round to buy time, so the metric is a constraint rather than a scoreboard.
How the 10 SaaS Metrics Compare at a Glance
| Item | Measures | Best Used For | Main Limitation |
|---|---|---|---|
| Monthly Recurring Revenue (MRR) | Normalized monthly value of active recurring subscriptions | Tracking subscription revenue and monthly growth | Does not show profitability or acquisition costs |
| Annual Recurring Revenue (ARR) | MRR multiplied by 12 | Comparing annual-scale recurring revenue and planning | A single month may overstate stability |
| Customer Churn Rate | Customers lost during a period divided by customers at the start | Assessing customer retention and identifying churn patterns | Customer counts do not reflect the revenue value of lost customers |
| Net Revenue Retention (NRR) | Existing-customer revenue after expansion, contraction, and churn, divided by starting revenue | Evaluating growth and retention within existing customer cohorts | Can be skewed by a few large accounts |
| Average Revenue Per User (ARPU) | Recurring revenue divided by paying customers | Assessing pricing, plan mix, and monetization | Averages can hide customer-level differences |
| Customer Acquisition Cost (CAC) | Acquisition costs divided by new customers acquired | Evaluating acquisition efficiency and comparing channels | Attribution is difficult and incomplete costs can understate CAC |
| Customer Lifetime Value (LTV) | Estimated customer gross profit over the customer relationship | Setting acquisition budgets and evaluating unit economics | Highly sensitive to churn and other assumptions |
| LTV to CAC Ratio | LTV divided by CAC | Summarizing acquisition efficiency and guiding growth investment | Relies on accurate LTV and CAC estimates |
| CAC Payback Period | CAC divided by monthly gross profit per customer | Assessing how quickly acquisition costs are recovered | Does not account for churn after payback |
| Burn Multiple | Net cash burned divided by net new ARR | Evaluating capital efficiency in growth-stage companies | Not meaningful for cash-flow-positive businesses |
Start With Three Metrics and Build From There
Three metrics are enough to begin with: MRR, churn and CAC. They cover what you sell, whether it stays sold, and what it costs to sell more. Pull all three from your billing provider rather than a spreadsheet, and check them on the same day each month so the comparison means something across periods.
Add NRR, LTV and payback once you have cohort data worth reading. That usually means twelve months of history and enough customers per cohort that one account leaving doesn't shift the number by ten points. Before that, NRR is a story you tell yourself in a board update, and LTV is arithmetic dressed up as evidence.
Every metric on this list needs three things written down before it goes anywhere public: the formula, the time window, and what's included. A number without all three is an opinion with a decimal point. When a buyer asks how you calculated retention, the answer "beginning ARR plus expansion minus churn and downsell, fixed twelve-month cohort, new customers excluded" is worth more than a clean chart.
The check that matters most is where the number comes from. Revenue read from a connected billing account can be verified by a stranger. A figure typed into a profile cannot, and the gap between self-reported and provider-read numbers is where most acquisition conversations fall apart. If your own churn, ARPU and payback are computed from billing data, listing numbers from the same source costs you nothing extra.
That logic shaped how we handle listings. Founders can list a SaaS for free on BootstrapArena, and the MRR and ARR figures are read from the billing account they connect with a read-only key rather than entered by hand. A business billing at zero today can still list, so the first month of tracking doesn't have to wait for the first payment.
Start with three numbers, define them properly, read them from the system that holds the truth, and add the rest when the cohorts can carry the weight. The founders who get this right aren't the ones with the most metrics. They're the ones whose metrics survive a follow-up question.
BootstrapArena publishes the metrics this article argues for, read straight from the billing account you connect with a read-only key, so MRR, ARR and your twelve-month revenue chart update without a spreadsheet in the loop. List a SaaS, store or app for free and see how your numbers sit beside other bootstrapped businesses, including the ones billing at zero today. Visit BootstrapArena to create your listing and let the billing data do the reporting.