MRR vs ARR: Formulas, Differences and When to Use Each
MRR vs ARR explained: formulas, worked examples, when each metric fits, and where both can mislead founders, buyers and investors.
MRR is the normalized monthly value of active recurring subscriptions, and ARR is the annualized value of those same contracts, usually MRR × 12. A SaaS business with 100 customers paying $50 per month carries $5,000 MRR and $60,000 ARR, and both figures come from one book of business.
That's where most explanations stop, usually with a shrug and a "just multiply by 12." The shortcut holds only while contract mix, usage and customer count sit still. It breaks the moment someone prepays a year, a usage-priced account has a strong month, or a discount expires mid-contract, because then the annualized figure describes a month that may never repeat.
So the decision before a founder or buyer is not which metric is superior. It's which figure can be published transparently, how it gets labelled, and what needs to accompany it before two businesses can be compared.
MRR vs ARR at a Glance
Both measures come from a single book of business. Stripe's guide to MRR and ARR-and-annual-recurring-revenue-(arr)) defines monthly recurring revenue as the normalized monthly value of active recurring subscriptions, converting annual, quarterly and monthly contracts into comparable monthly amounts while excluding one-time fees and non-recurring services. Annual recurring revenue takes those same contracts and expresses the base across a year, commonly as MRR multiplied by 12.
Normalization does all the work. One customer who prepays $12,000 for a year enters the monthly base at $1,000 and the annual base at $12,000. Nothing changed about the business, only the horizon.
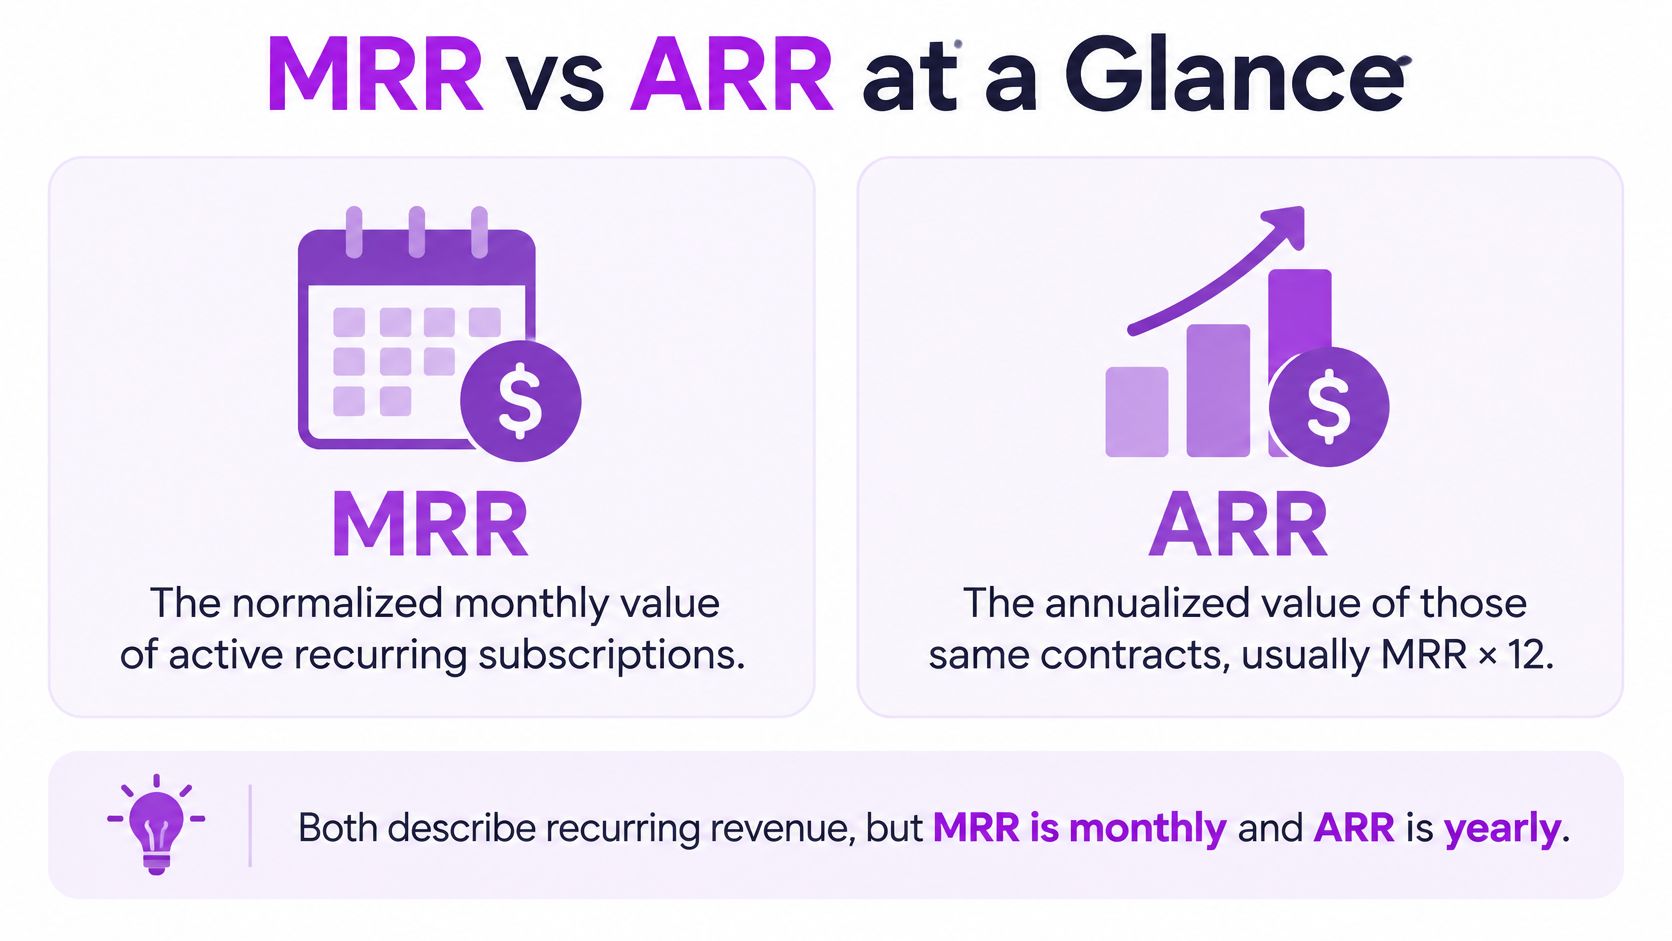
Same base, different horizon: MRR answers what one month of the recurring base produces. ARR answers what that base is worth across a year. Neither answers how much revenue has been earned.
MRR and ARR side by side
| Dimension | MRR | ARR |
|---|---|---|
| Definition | Normalized monthly value of active recurring subscriptions | Annualized value of the same recurring contracts |
| Standard formula | Sum of monthly-normalized contract values | MRR × 12, or the sum of annualized contract values |
| Time horizon | Current month run rate | Current annual run rate |
| Sensitivity to change | High, since one upgrade or churned account moves it visibly | Lower in relative terms, but every monthly change is multiplied by 12 |
| Typical user | Founders tracking momentum and monthly movement | Investors, buyers and anyone planning annually |
| Main risk | Hides how much revenue comes from annual prepayments | Can overstate sustainable demand when one month is unusual |
Stripe describes both measures as predictable-revenue metrics rather than GAAP revenue, which is why neither appears on an income statement as earned revenue or as cash collected.
The question narrows quickly from there. Watching whether last month's pricing change moved anything is an MRR question. Putting a scale figure in front of an investor or building next year's plan is an ARR question. Whatever gets published needs a run-rate label, a measurement date and a billing currency, because a number missing those three things can't be compared to anything.
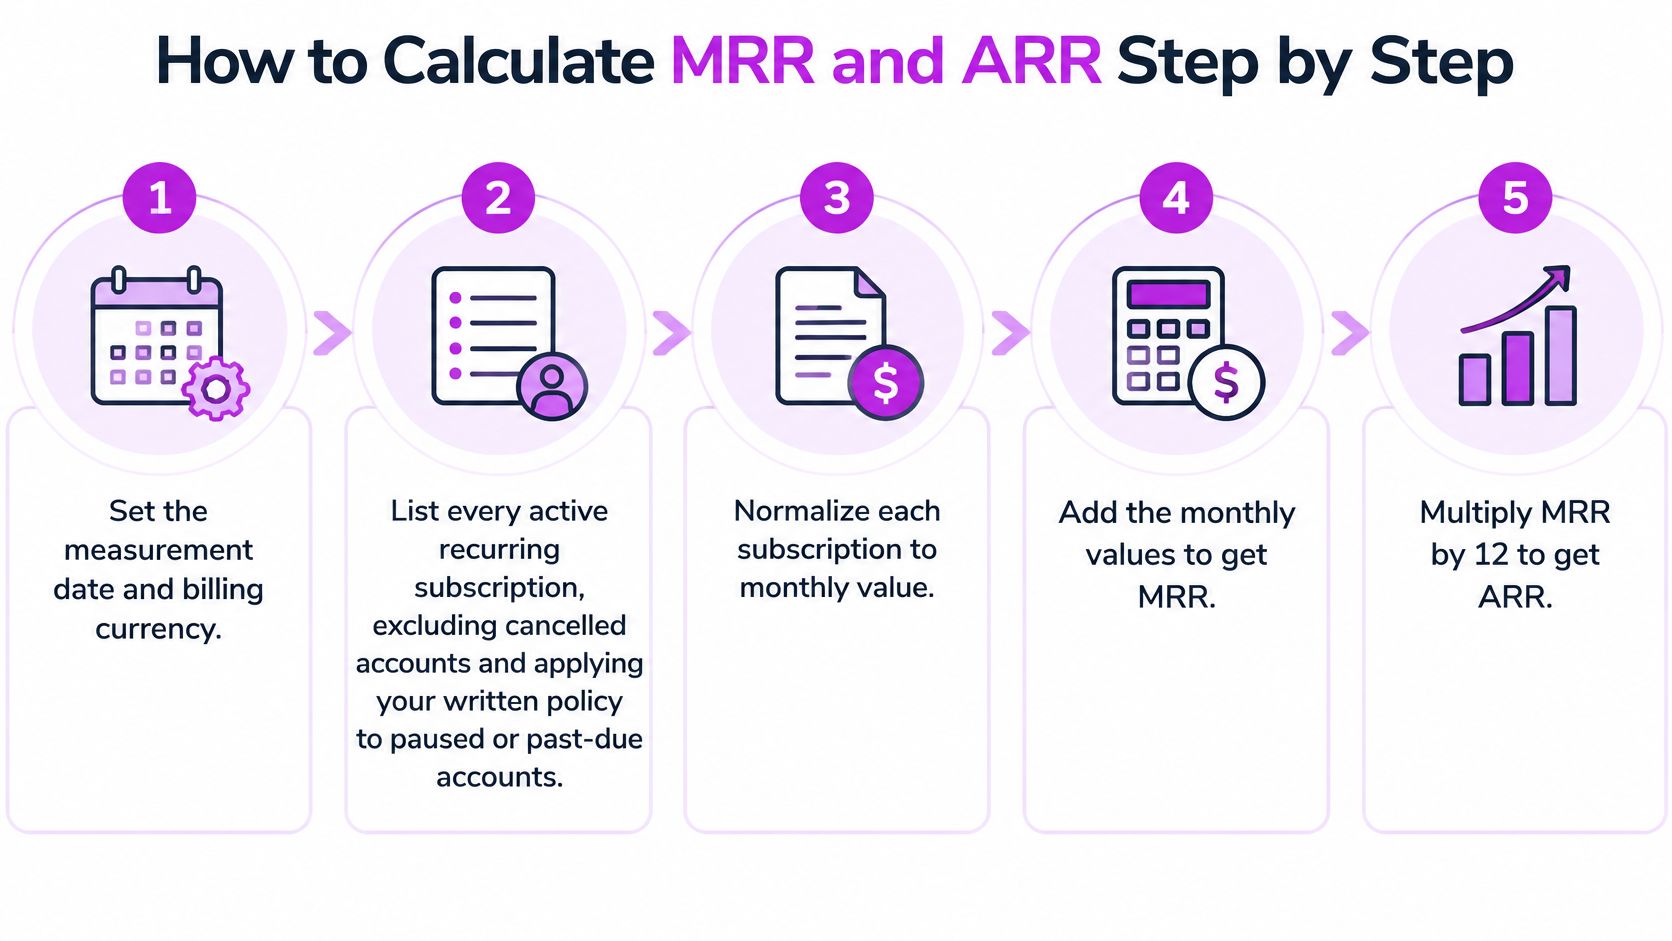
How to Calculate MRR and ARR Step by Step
Six steps, in order, each one fixing a specific way the figure goes wrong.
- Set the measurement date and billing currency first. Recurring revenue is a snapshot, so an undated number can't be reconciled or compared. Multi-currency businesses also need to fix whether contracts translate at period rates or constant currency.
- List every active recurring subscription, and only active ones. Cancelled accounts are out. Paused, past-due and trial accounts follow a written policy you apply identically every close, rather than a judgment call in the moment.
- Normalize each contract to a monthly amount. A monthly plan stays as billed, a quarterly plan divides by three, an annual plan divides by twelve. This is what makes a $150 quarterly customer comparable to a $50 monthly one.
- Add the monthly amounts to get MRR. The sum is your current monthly run rate, not a month of recognized revenue.
- Multiply by 12 for ARR, or sum annualized contract values if you hold contracts directly. The two methods agree on flat contracts and diverge on ramped ones.
- Strip one-time fees from both. Setup, implementation, consulting, migration and hardware don't recur, so including them inflates the run rate and collapses at the next renewal.
The conversion works the same way across every contract type, which is the point of normalizing in the first place.
How contract types convert to MRR and ARR
| Contract type | Customer pays | MRR contribution | ARR contribution |
|---|---|---|---|
| Monthly plan | $50 per month | $50 | $600 |
| Quarterly plan | $150 per quarter | $50 | $600 |
| Annual plan | $600 per year | $50 | $600 |
| Annual prepayment with discount | $12,000 for one year | $1,000 | $12,000 |
Row four is the one people get wrong. A $12,000 annual prepayment contributes $1,000 to MRR, not $12,000, because the cash arrived in one month while the service is delivered across twelve. Count the full amount in MRR and January shows a spike and February a collapse, neither of which happened.
The conversion reverses cleanly too. Divide any ARR figure by 12 to recover the average monthly run rate, so $60,000 ARR returns $5,000. If that result doesn't match the billing dashboard, the two figures were built on different rules.
ARR isn't recognized revenue, and the gap can be large. DualEntry's comparison of ARR and MRR notes that ARR is a point-in-time operating measure based on active recurring contracts, while accounting revenue is recognized over the period the service is delivered. A business with $20,000 MRR at December 31 can report $240,000 ARR and still recognize less than $240,000 of revenue in that calendar year, if subscriptions started late, customers prepaid annually or contracts expanded mid-year.
Before publishing anything, tie the MRR total to the billing dashboard line by line and record which accounts were excluded and why. That reconciliation is what turns a calculated figure into a defensible one.
Where ARR Stops Being MRR Times Twelve
Most MRR vs ARR comparisons treat the multiplication as the end of the story. It's a run-rate convention, not an identity, and it holds only while contract mix, usage and customer count stay flat. MRR is a flow, so an odd month is just an odd month. ARR annualizes the contract base at a point in time, which means whatever is true on that one date sets the figure for a full year.
Cases where ARR differs from MRR × 12
| Case | Effect on MRR | Effect on ARR | What to disclose |
|---|---|---|---|
| Annual prepayments | Spread across 12 months as one-twelfth | Counted at full annual value | Whether ARR is contracted or recognized |
| Usage-based charges | Reflects only the current month's usage | Often extrapolated from a single month | A trailing twelve-month figure alongside |
| Discounts and promotional pricing | Lower normalized value | Lower if the discount is in the contract | Discount expiry date and list price |
| One-time setup or consulting fees | Excluded | Excluded | Confirmation that one-time fees are out |
| Paused or past-due subscriptions | Depends on the written policy | Depends on the written policy | The policy used for each status |
| Seasonal sales peaks | Spikes in peak months | Overstated if annualized from a peak month | Trailing twelve-month totals |
Prepayments and discounts are the visible pair. A prepayment spreads across twelve months in MRR and lands at its full annual value in ARR, so the headline figure describes a contract that hasn't been delivered yet. A promotional discount set to expire in month seven lowers today's normalized value and lifts it later, which means ARR at signature is not ARR at renewal. Show the expiry date and the list price and the reader can do that math themselves.
Usage-based charges are harder to spot. Annualizing a heavy consumption month projects that month across the year, and annualizing a quiet one understates the business just as badly. Seasonality does the same on a calendar, where a peak month and a trough month produce two very different annualized figures from an identical contract base.
Policy items are quieter still. If a paused account keeps counting, ARR measures contracts signed rather than service delivered. If a one-time implementation fee slips into the recurring base, next year's renewal falls short of the forecast.
Choosing which number to publish is where the danger lies. HiBob's 2025 SaaS performance metrics benchmarks recommend evaluating usage or hybrid businesses on a year-over-year or trailing-twelve-month basis so seasonal effects are captured, and finance guidance consistently separates ARR from both GAAP revenue and cash collected. That leaves the question most posts never answer: should a founder, buyer or investor publish current-month MRR × 12, contracted ARR, recognized recurring revenue, or a trailing twelve-month total? The honest answer is that a lower but stable trailing figure is frequently more decision-useful than a higher annualized run rate built from one unusually strong month.
Benchmarks That Put Each Number in Context
A recurring revenue figure without a comparison is a score with no league table. These ranges give the comparison, and every one of them is directional.
Growth and retention reference ranges
| Benchmark | Reference range | Caveat |
|---|---|---|
| Seed-stage MRR growth | 10–20% per month | Directional; sample and definitions vary |
| Series A MRR growth | 5–10% per month | Directional; sample and definitions vary |
| Series B and later MRR growth | 3–5% per month | Directional; sample and definitions vary |
| Enterprise SaaS net revenue retention | Often above 120% | Enterprise contracts retain differently |
| SMB-focused SaaS net revenue retention | About 90–100% | Higher churn is normal in this segment |
| Median SaaS annual revenue growth, 2024 | About 26% | Benchmark samples differ |
The ranges above come from a compilation of SaaS performance metrics and benchmarks, which is also explicit that they aren't universal standards. Samples differ, definitions differ, and a company counting usage revenue in ARR isn't measuring the same thing as one restricting it to subscription fees.
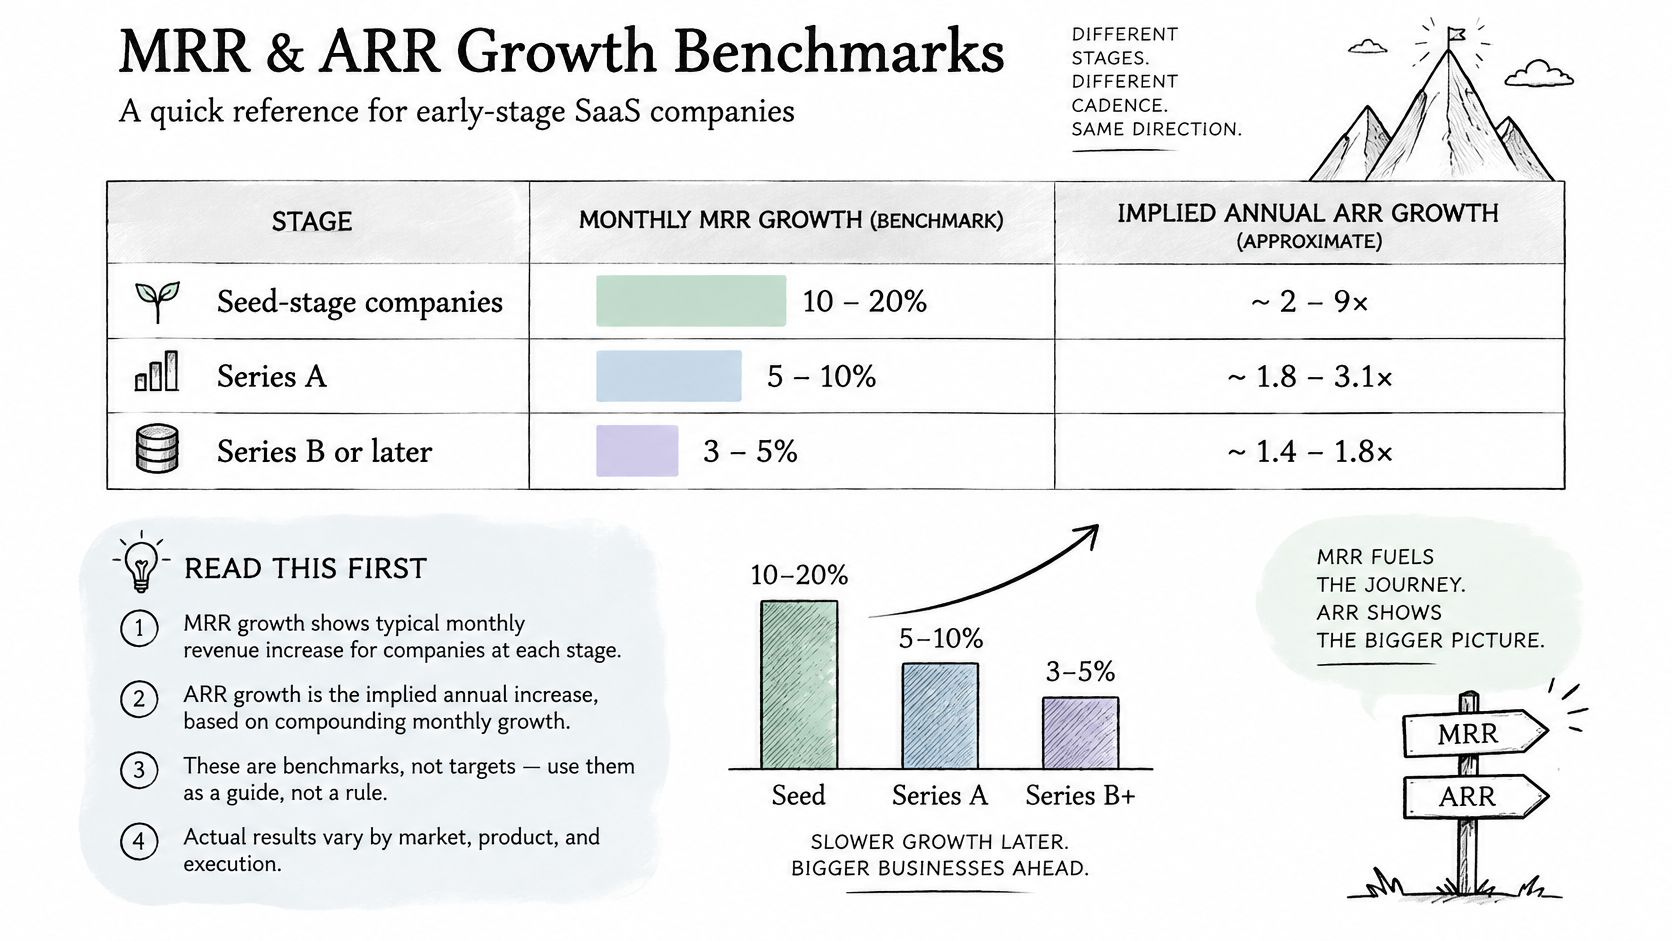
Read in this order. Start with MRR as the current recurring base, then ARR as its annualized scale. Next to them, check ARR growth, gross and net revenue retention, logo churn, gross margin and cash runway. A high ARR with weak retention is less durable than a smaller base that keeps its customers, which is why the retention line outranks the revenue line in any serious comparison.
Net revenue retention equals starting MRR plus expansion, minus contraction, minus churn, all divided by starting MRR, measured on the same customer cohort over the same period. A cohort starting at $10,000 MRR that adds $1,500 of expansion while losing $500 to contraction and $1,000 to churn lands at 105%. Run the same cohort through gross retention and the expansion line disappears.
Why retention carries the argument: expansion is now doing a lot of the growth work. Expansion ARR accounted for 40% of total new ARR in 2024, a five-percentage-point rise on the prior year, according to Benchmarkit's 2025 SaaS Performance Metrics. Businesses that can't expand have to buy every point of growth.
Segment before comparing anything, too. Subscription software, e-commerce and mobile apps don't produce recurring revenue the same way, and ARR is naturally strongest where subscriptions dominate. If you're weighing a listing against a multiple, our SaaS valuation guide sets out how buyers apply revenue multiples to the figure you publish.
What MRR and ARR Cannot Tell You
Two businesses can publish the same ARR and mean entirely different things by it. That's not a rounding problem, it's a definition problem, and it makes the label more important than the number.
Rillet's guide to SaaS financial KPIs states the limitation directly: MRR and ARR are point-in-time run-rate metrics, not recognized revenue, cash collected, bookings or profit. Two companies can report identical ARR while treating discounts, annual prepayments, paused accounts, usage-based charges, past-due subscriptions and trials differently. The figure is comparable only when the treatment is disclosed.
Where the same number hides different policies. An annual prepayment lifts cash in the month it's collected, so a strong cash month says nothing about whether customers stay. Heavy discounting can inflate new ARR while shrinking the revenue that survives once promotions expire, which is why the expiry date and list price belong next to the number.
Customer concentration is the next blind spot. One account holding a large share of MRR makes a base look stable right up until renewal, so report the share of MRR held by your top accounts. Trials and past-due subscriptions need a written rule stating whether they count, and that rule has to survive a change of finance lead.
Practical rule: if a figure can't be reconciled to the underlying subscriptions, it isn't a metric yet. It's an estimate wearing a label.
Our own display rules follow that discipline. MRR and ARR are read directly from a startup's billing provider rather than self-reported, and MRR follows the same rule as Stripe's dashboard: active subscriptions, per month, with tax excluded. For online stores connected through Shopify Payments there are no subscriptions to normalize, so the page shows net sales for the last 30 days labelled Sales (30d) instead of an MRR figure.
Revenue that never reaches the ledger is the operational version of the same problem, and spotting revenue leakage before month-end close covers where recurring revenue disappears between contract and invoice.
The phrase itself has spread faster than any definition of it. CX Cash's analysis of SEC filings found "annual recurring revenue" in 118 annual reports filed in 2025, against 42 in 2020 and 10 in 2015. Adoption climbed; a common standard didn't.
Every published figure needs four things attached: the measurement date, the billing currency, the recurring-revenue policy, and a note on whether ARR is mechanically annualized from MRR or built from annual contract values. The definitions we apply across listings are set out in our SaaS metrics guide.
Choosing and Confirming the Right Metric
The choice follows the question. Monthly momentum points to MRR. Annual scale and valuation point to ARR. Answer the question first and the metric picks itself.
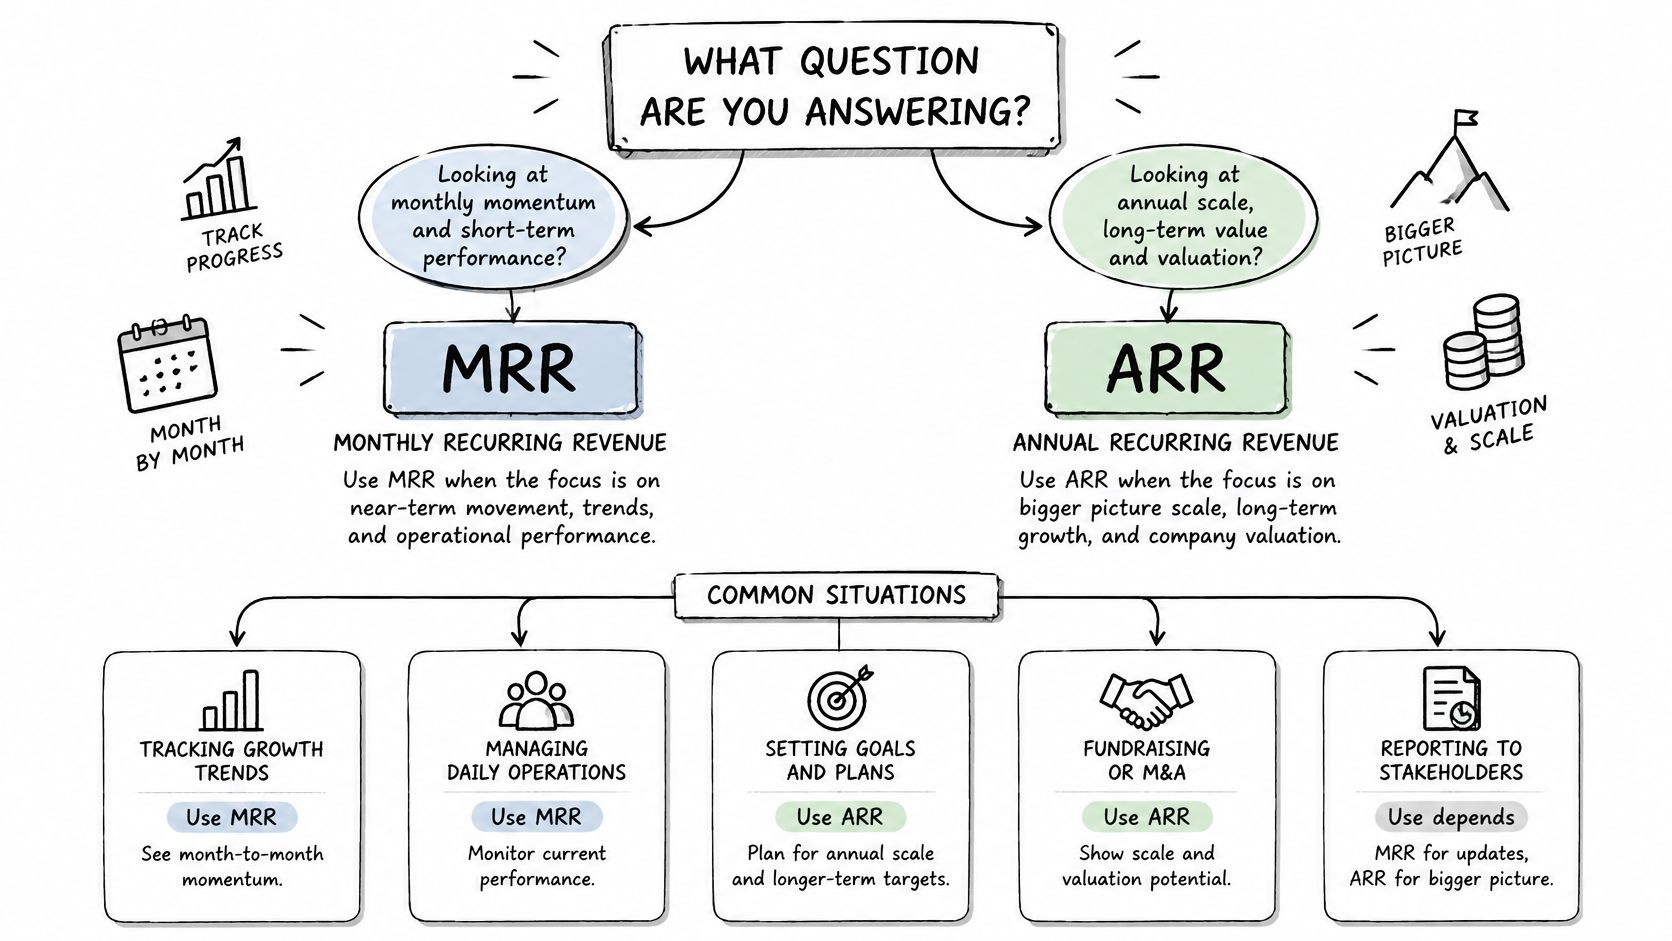
A founder reviewing weekly progress wants the MRR waterfall, splitting movement into new, expansion, contraction, churn and reactivation. That breakdown tells her which lever moved. A founder sitting at $8,000 MRR with a rising churn line learns more from that split than from any annualized total, because the annual figure multiplies a problem twelve times without naming it.
Fundraising and annual planning run on ARR, which puts every contract on a common annual scale. Buyer diligence needs both: ARR for scale, MRR history and trailing-twelve-month totals for stability. Directory rankings ordered by verified MRR favour current momentum, while acquisition screens read ARR, MRR and growth together. On our marketplace, listings show the asking price and, for verified startups, the MRR read from the billing provider alongside the revenue multiple. Our revenue leaderboard ranks startups by verified MRR in USD, and once a listing's revenue key is connected, the exact MRR and ARR sync automatically from the billing tool.
If a video walkthrough suits you better than a table, this covers the same ground.
Growth alone won't settle a comparison either. A smaller business with slower ARR growth and strong retention can be the better asset than a faster grower constantly replacing churned customers. Founderpath's analysis of SaaS growth rates puts numbers on that link: moving net revenue retention from the 90–100% band to 100–110% is associated with roughly five additional percentage points of growth.
The decision rule: publish the metric the reader's decision requires, and never choose it because it looks larger.
The labelling checklist that keeps any published figure honest:
- State the purpose. Say whether the figure supports an operating decision, a fundraise, a sale or a directory listing.
- Label it a run rate, with its measurement date and billing currency in the same line.
- Confirm inclusions and exclusions, covering usage charges, discounts, annual prepayments, one-time fees, and paused or past-due accounts.
- Add a trailing twelve-month total beside the run rate for usage-based, seasonal or one-time-heavy businesses.
- Pair it with growth and net revenue retention before anyone draws a conclusion about quality.
- Compare only like with like, which means subscription SaaS against subscription SaaS, e-commerce against e-commerce.
A finance team tracking KPIs across mixed revenue lines will recognise the pattern, and these practical KPI examples for Jacksonville businesses show how the same discipline applies outside software.
Pick the metric by the decision it supports, not by which number looks larger.
If you want a recurring revenue figure you can defend in a diligence call, the version that matters is the one read from the billing provider rather than typed into a form. BootstrapArena connects to Stripe, Shopify Payments and a dozen other billing tools, then publishes verified MRR and ARR on a Google-indexed listing with a twelve-month revenue chart beside it. List your business free, connect a read-only revenue key, and let the figures that buyers check sync themselves.